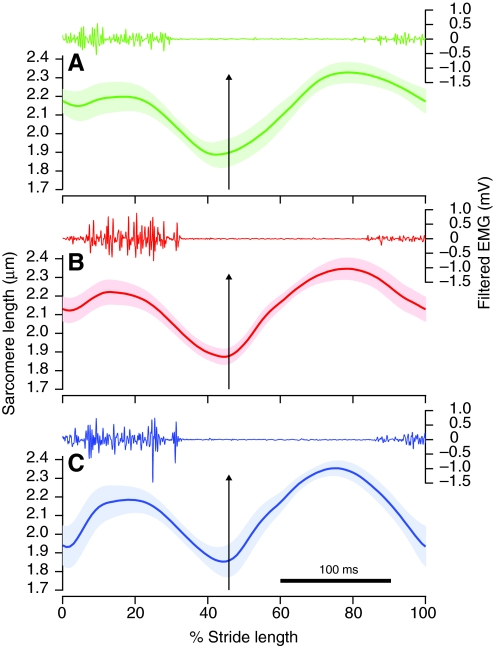
Fig. 2.
The mean proximal (green, A), central (red, B) and distal (blue, C) sarcomere lengths of the ILPO posterior fascicles of the guinea fowl running at 2.5 m s–1 for one stride. Time axis is expressed as a percentage of the stride duration from foot-down to foot-down. The black bar in C indicates 100 ms. The black arrow indicates toe-off. The shaded areas represent ±1 s.e.m. One representative filtered EMG trace is also shown for each segment.

