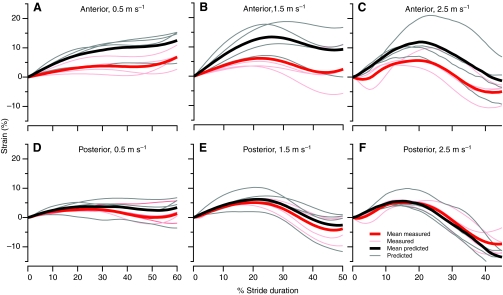
Fig. 9.
Mean predicted (thick black lines) and measured (thick red lines) active strain in the anterior (A–C) and posterior (D–F) ILPO during running at 0.5 m s–1 (A,D); 1.5 m s–1 (B,E); and 2.5 m s–1 (C,F). The thin lines indicate the individual predicted (gray) and measured (pink) curves for each animal. The curves for the modeled and measured strain were aligned at 0 strain at the beginning of the stride. The curves for the modeled and measured strain in the anterior fascicles diverge during active lengthening; however, modeled and measured active shortening are similar.

