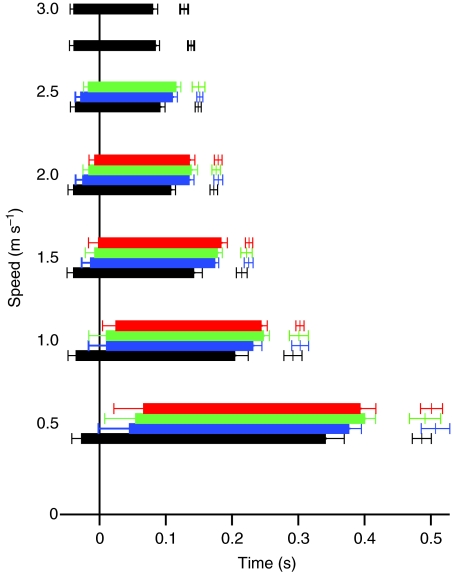
Fig. 6.
The period of electromyographic (EMG) activity in the ILPO at different speeds and slopes. Zero time indicates foot-down. The mean start and stop times for the EMG burst are connected with a thick bar, with thin error bars at the ends indicating ±1 s.e.m. Values are grouped by speed on the vertical axis with the slope indicated by color (0%, black; 10%, blue; 15%, green, 20%, red). The thin bars on the right indicate the mean stance times ± 1 s.e.m.

