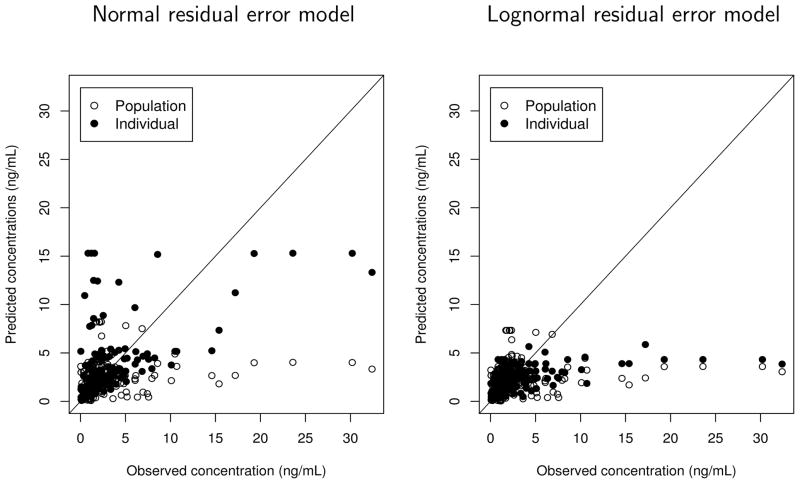
Figure 1.
The observed dexmedetomidine (DEX) plasma concentrations versus the predicted ones (empty circles: population fitted values based on the fixed-effects estimates and the random effects being equal to their mean value 0; filled circles: the conditional expectation of DEX concentrations given the estimates of random effects) obtained from the conventional population PK analysis implemented by NONMEM using the normal proportional residual error model (left panel) and lognormal residual error model (right panel).

