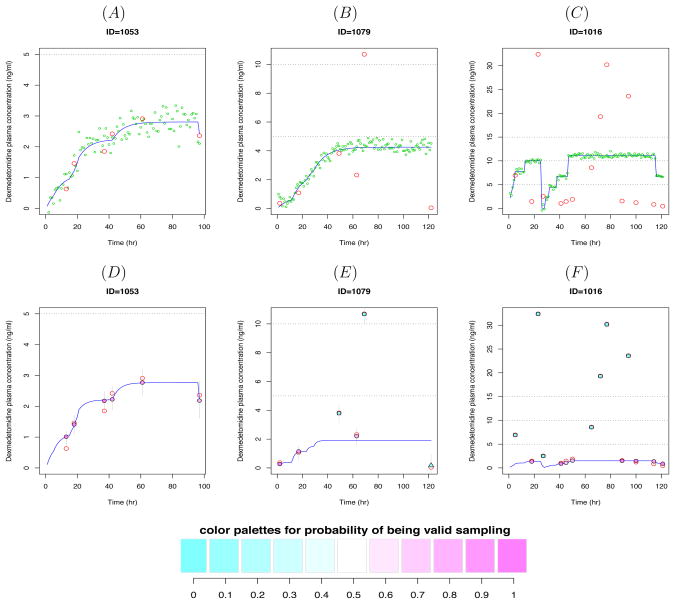
Figure 2.
Dexmedetomidine (DEX) plasma concentration-time profiles for 3 subjects. The red empty circles represent the observed DEX concentrations. Upper panel: The blue solid lines represent the predicted concentrations from individual PK data fits by NONMEM and the green dots are simulated values from the estimated model. Lower panel: The solid circles, squares and triangles represent the posterior means of the individual predicted concentrations obtained from Bayesian hierarchical nonlinear mixture model. The circles represent data points classified as valid whereas the squares and triangles are classified as artifactual outliers (the second and third component, respectively). Each point is filled with color in proportion to the w1, the probability of being a valid concentration. The blue solid lines represent the predicted concentrations from the model given the posterior means of individual PK parameters. The 95% credible intervals are represented by thin gray vertical lines.

