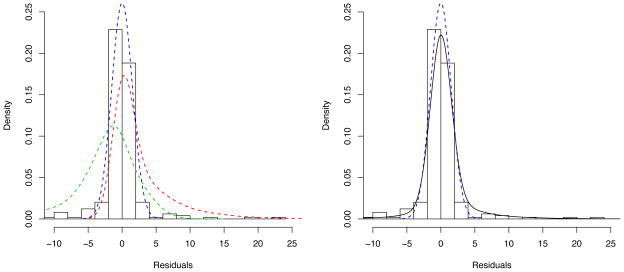
Figure 3.
A distribution of residuals obtained from the conventional population PK analysis with the normal proportional residual error model is overlaid by a normal density curve (blue dashed line). A three-component mixture density curve is represented by black solid line on the right panel, which is defined by , where Q = 3, d1 = N(0, τ1), d2 = N(0, τ2) * Ga(a, b), d3 = N(0, τ3) * NGa(c, d), w1 = 0.66, w2 = 0.24, w3 = 0.10, τ1 = τ2 = 0.09, τ3 = 9, a = c = 1, and b = d = 0.2. These three components are separately presented by blue (d1), red (d2) and green (d3) dashed lines, respectively, on the left panel.

