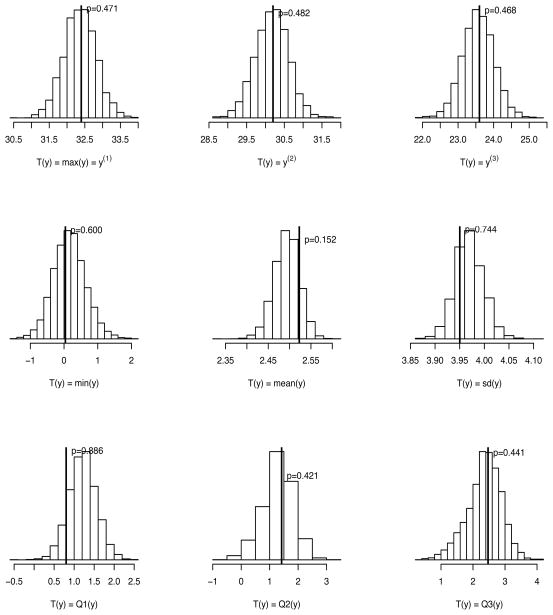
Figure 5.
The posterior predictive distributions of T(yrep) along with T(y) represented by vertical lines and the corresponding posterior predictive P–values. The discrepancy measures T(y) are the first three largest order statistics (y(1), y(2), y(3)), the minimum (min(y)), the mean (mean(y)), the standard deviation (sd(y)), and the three quartiles (Q1(y), Q2(y), Q3(y)).

