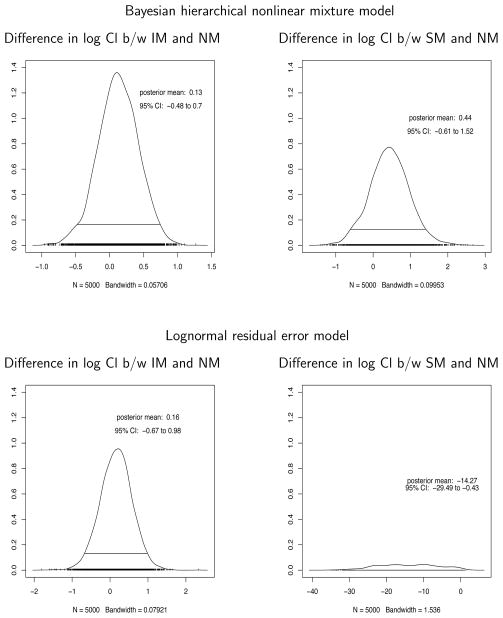
Figure 6.
The posterior distributions of the difference in log clearances (log Cl) between intermediate metabolizers (IM) and normal metabolizers (NM), and that between slow metabolizers (SM) and NM from Bayesian hierarchical nonlinear mixture model (upper panel) and from lognormal residual error model implemented in Bayesian framework (lower panel). The posterior means and 95% credible intervals (CI) are also presented.

