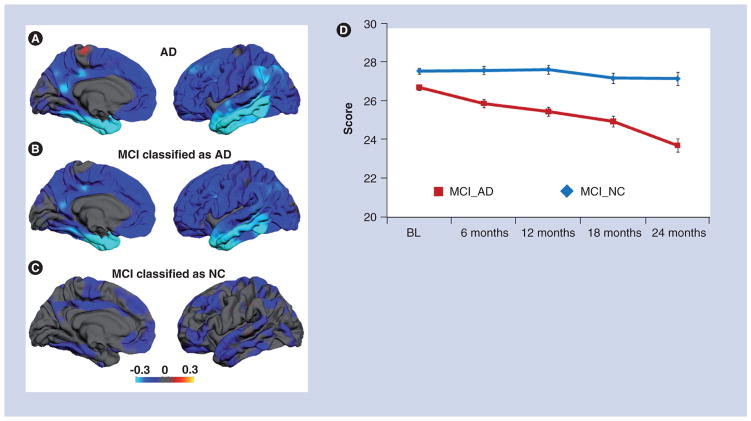
Figure 1. Regional atrophy patterns in mild Alzheimer’s disease and mild cognitive impairment.
(A) The average difference in thickness (mm) for 84 patients with mild AD relative to 139 controls are shown on medial (left) and lateral (right) views of the pial surface of the left hemisphere. Greatest thinning is observed in medial and lateral temporal areas, but significant thinning also appears across association cortices. (B) Average thickness difference for MCI subjects who were classified as ‘AD’ by a discriminant and control data. Although less severe, the atrophy pattern is very similar to that of AD subjects. (C) MCI subjects classified as ‘normal control’ by the discriminant model. These subjects show significantly less atrophy, particularly in medial temporal regions, subjects classified as ’AD’. For all brain images, the scale reflects thickness differences ranging from −0.3 (yellow)
(D) Average Mini-Mental State Examination score over time for MCI subjects classified as ‘AD’ and those classified with phenotypic AD atrophy showed significant, steady cognitive decline over a 2-year period, whereas those without the phenotypic AD atrophy pattern remained cognitively stable.
Brain images are reprinted with permission from [60].
AD: Alzheimer’s disease; BL: Baseline; MCI: Mild cognitive impairment; NC: Normal control.

