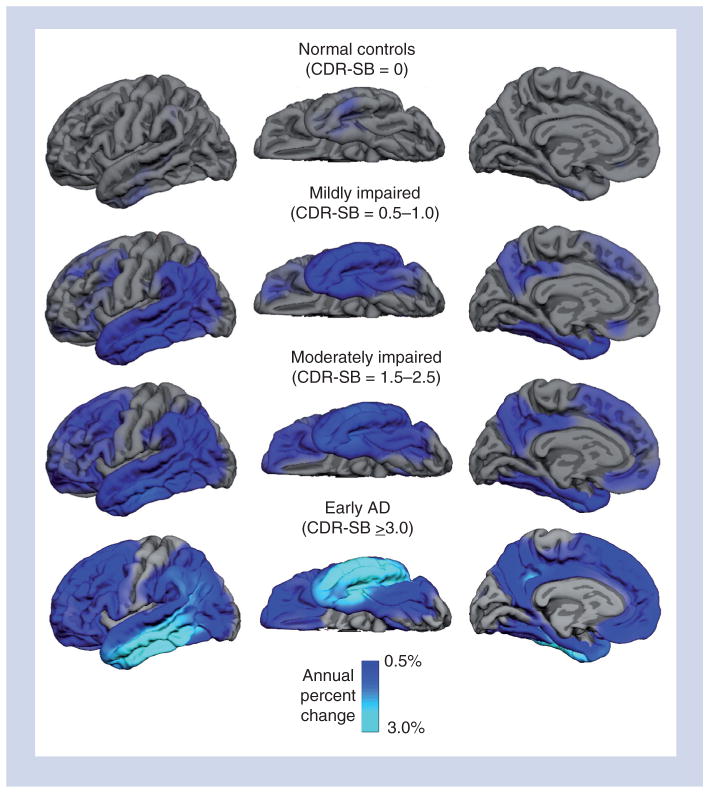
Figure 2. Annual atrophy rates as a function of degree of clinical impairment as assessed with baseline CDR-SB.
Mean atrophy rates are represented as a percent change in neocortical volume and mapped onto the lateral (left), ventral (middle) and medial (right) pial surface of the left hemisphere. These data demonstrate that atrophy rates are most prominent in medial and lateral temporal regions early in the course of disease, spreading to parietal and frontal regions as the level of impairment increases, with relative sparing of sensorimotor regions. The scale reflects annual percent change ranging from 0.5 (dark blue) to 3.0%. Note that the scale is optimized for showing disease-related change, rather than change in normal aging.
CDR-SB: Clinical Dementia Rating Sum of Boxes score.
Reprinted with permission from [58].

