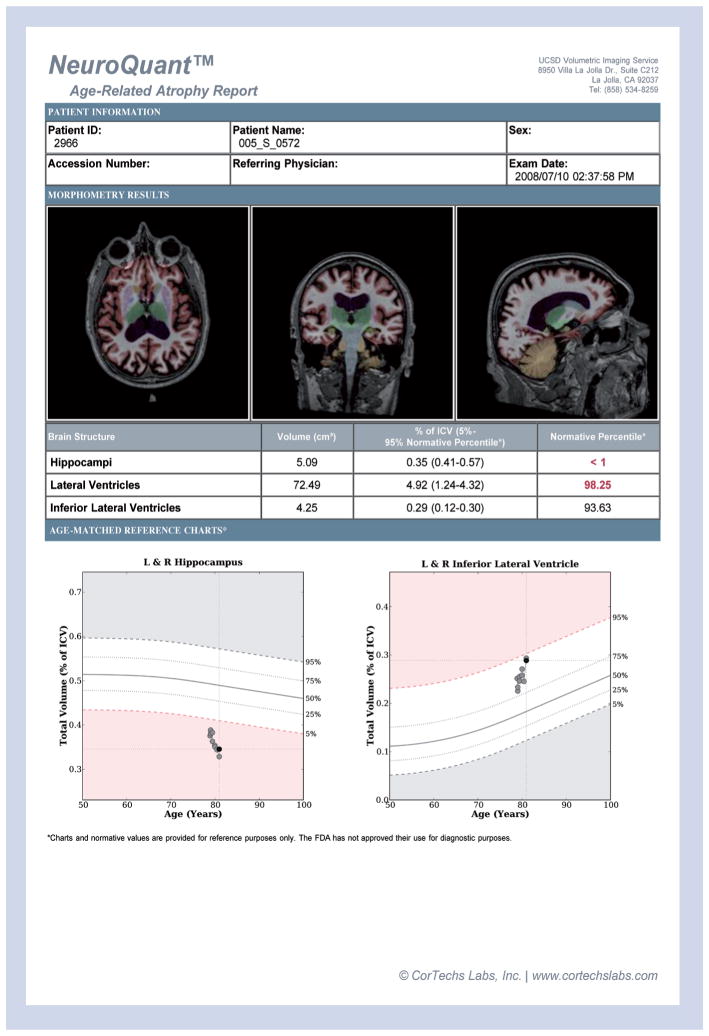
Figure 3. NeuroQuant report from a mild cognitive impairment patient scanned longitudinally for 2 years as a volunteer in the Alzheimer’s Disease Neuroimaging Initiative study.
Ten scans (two from each timepoint) were analyzed using NeuroQuant. From top to bottom, the report consists of demographic information; a row of axial, coronal and sagittal MR images with a color overlay of the segmentation results; a table reporting the volume, the volume as a percent of intracranial volume and the volume’s percentile score based on the normative database for bilateral hippocampus, lateral ventricle and temporal horn of the lateral ventricle; and normative graphs plotting the patient’s hippocampus volume and temporal horn volume, corrected for intracranial volume, relative to the expected range (in white) across the age range included in the normative database. For this patient, the baseline hippocampal volume of 5.09cc –corrected for age, sex and intracranial volume – was more than two standard deviations below that expected for their age, and continued to atrophy at a rate faster than would be expected in normal aging. The baseline temporal horn volume of 4.25cc was at the 77th percentile of that expected for age, and continued to enlarge at a rate faster than would be expected in normal aging. The patient progressed to Alzheimer’s disease at year 2.

