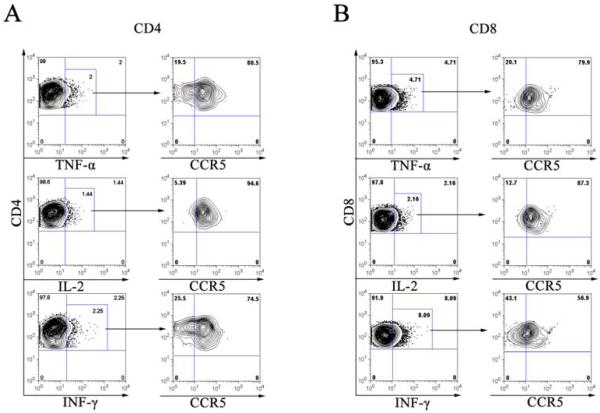
Figure 6. CCR5+ T lymphocytes and intracellular cytokine production of TNFα, IL-2 and IFN-γ.
Allogenic dendritic cells mixed with responder PBMCs (DC-MLR) at a DC:PBMC ratio of 1:100. The MLR cultures were treated with brefeldin-A on day 7 for 5 hours. The cells were harvested and stained with CD4, CD8, CCR5 and intracellular cytokines TNFα (top panel), IL-2 (middle panel) and IFN-γ (bottom panel). The left panel of A (CD4) and B (CD8) was the representative dot-plots of intracellular cytokine production and the gated cells were positive for the cytokine using autologous MLR sample as the reference. The right panel of A and B was the CCR5 expression of the gated cells from the respective upper panel and the quadrant gates were decided based on isotype control. Results were representative of four independent samples.

