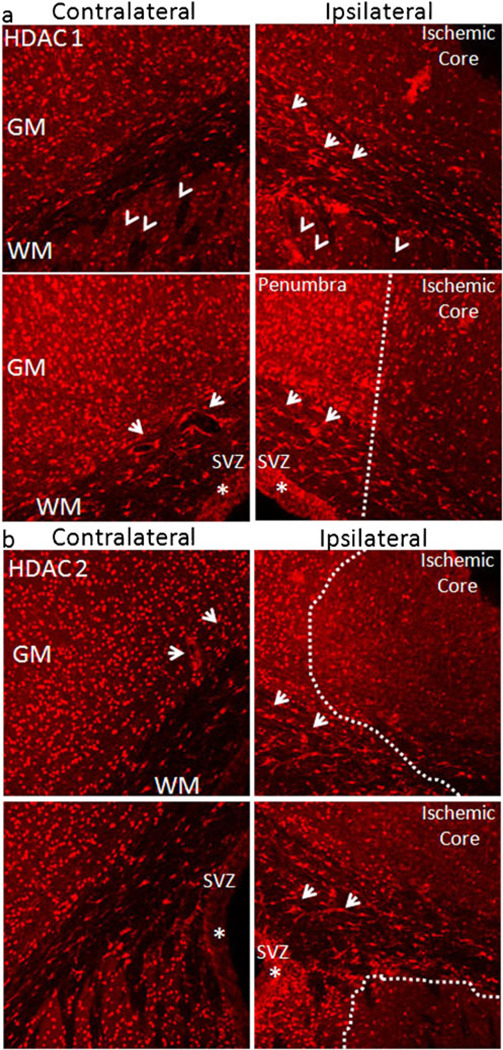
Fig. 6.
Ischemia upregulates HDAC 1 and HDAC 2 expression. a Following MCAo (ipsilateral, 45 min), HDAC 1 was reduced in the ischemic core (dotted line separates the ischemic core from the penumbra), but upregulated in spared neurons of the surrounding penumbra in cortex, striatum (arrowheads), SVZ (star), as well as in glial cells in the SCWM (arrows, right panels) compared with the corresponding contralateral regions (left panels). Note how capillaries were encircled with bright HDAC 1 labeling in contralateral sections (arrows, lower left panel). b Following MCAo (ipsilateral, 45 min), HDAC 2 was reduced in the ischemic core, but upregulated in spared neurons of the surrounding penumbra in cortex, SVZ (star), as well as glial cells in the SCWM (arrows, right panels) compared with corresponding contralateral regions (left panels). Note that some striatal neurons (outlined with dotted lines) demonstrated loss of HDAC 2, while those adjacent to the SVZ upregulated HDAC 2. Capillaries were regularly encircled with bright HDAC 2 labeling (contralateral section; arrows, upper left panel)

