
Figure 4.
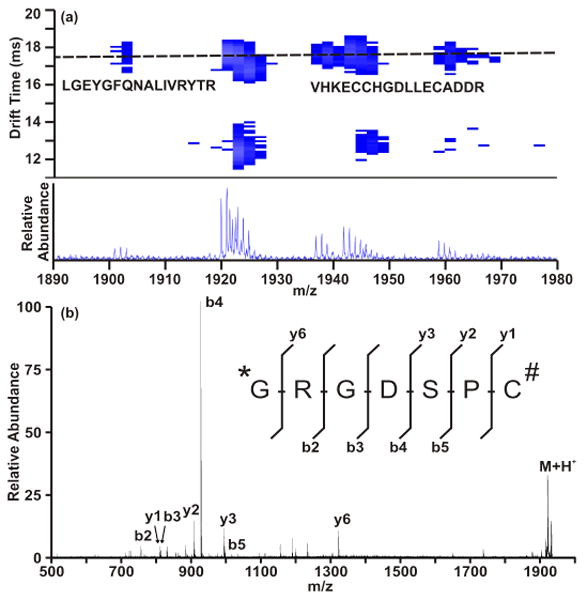
(A) representation of IM-MS analysis of multiplexed labeling. Briefly, a peptide (sequence shown in part (B)) was labeled at both the N-terminal primary amine (Tb labeled) and a cysteine residue (Ho labeled) according to scheme 1. Panel (A) illustrates the peptide correlation band (illustrated as a dashed line) showing a tryptic digest of bovine serum albumin. The lower peaks are due to the multiply labeled peptide shown in (B). The labeled peptide was subjected to MS/MS to ensure confident identification and label stability.