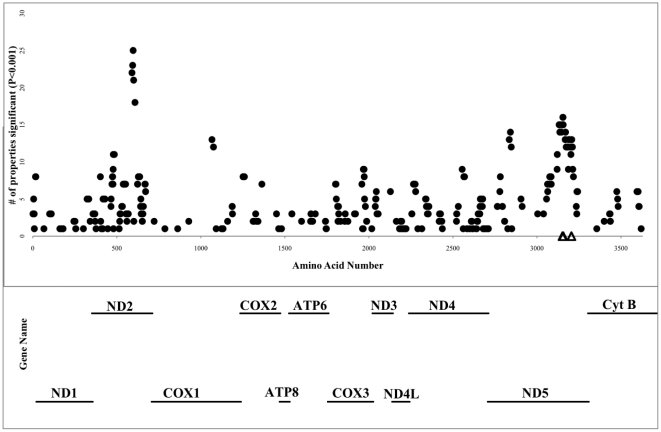
Figure 2. Summary of selection on the mitogenome of Oncorhynchus.
The 12 mitochondrial coding genes are represented and labeled (the figure does not include tRNAs or the ND6 gene). Filled circles represent positively selected sites (p<0.001) by TreeSAAP analysis. The dataset was analyzed for significance 31 times (for each of the 31 physicochemical properties). The y-axis represents the number of properties for which that site was determined to be subject to natural selection. Open triangles are positively selected sites identified by PAML analysis.

