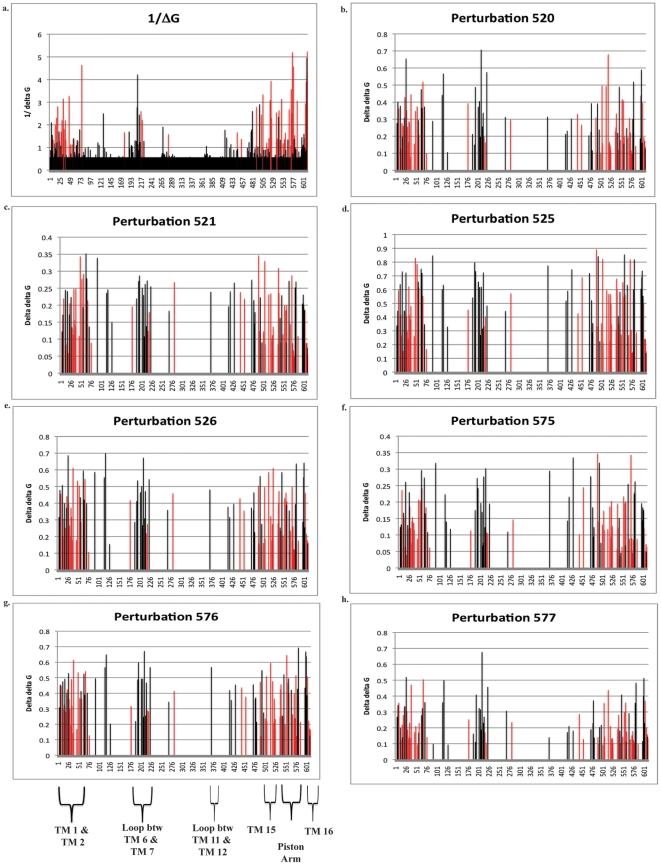
Figure 5. Results of the statistical coupling analysis from 428 ND5 amino acid sequences.
The graph of the inverse  (1/
(1/ ) shows sites that are ‘unconstrained’ (have a low
  value or high 1/
 value) in the ND5 protein compared to a random distribution of amino acids at each site in the MSA (5a). The inverse of
  is shown for visual simplicity. The y-axis is the 1/
 and the x-axis is the amino acid position. These could be ‘neutral’ sites or those under positive diversifying selection. The remaining graphs (5b–5h) are the
  values for each site in the MSA after perturbation for each of the selected sites. Red bars are those sites that are considered significant by TreeSAAP analysis in 15 species of Salmonidae only.

