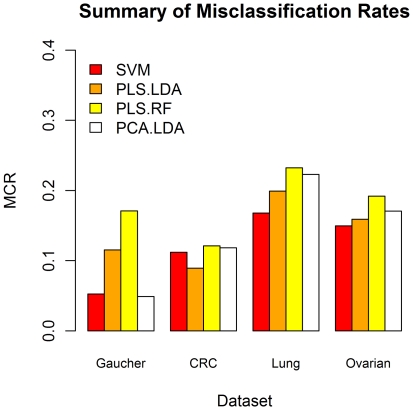
Figure 3. Summary of Misclassification results for all classifiers.
Summary of mean MCR results for each of the optimised classifiers on each trimmed dataset. These results demonstrate the MCR for each classifier using the optimal number of reduced components from the PLS-LDA (excluding SVM). Gaucher data uses a 7 component model, the LC data uses a 5 component model, the CRC data uses a 6 component model and the OC data uses a 3 component model for each.

