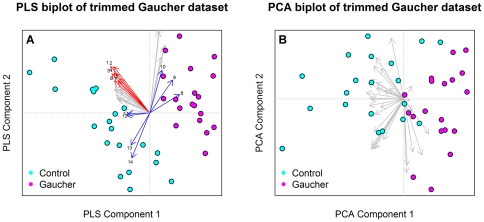
Figure 4. Comparison of PLS and PCA for dimension reduction.
These plots demonstrate the capacity PLS has to separate classes based on the top 30 variables ( Figure 4A ) in the Gaucher dataset when compared to PCA (Note that this class separation is being heavily influenced by the loadings highlighted in Blue. Additionally, the vectors highlighted in red explain the within class variation in the control group. This is a key advantage PLS has over other methods.

