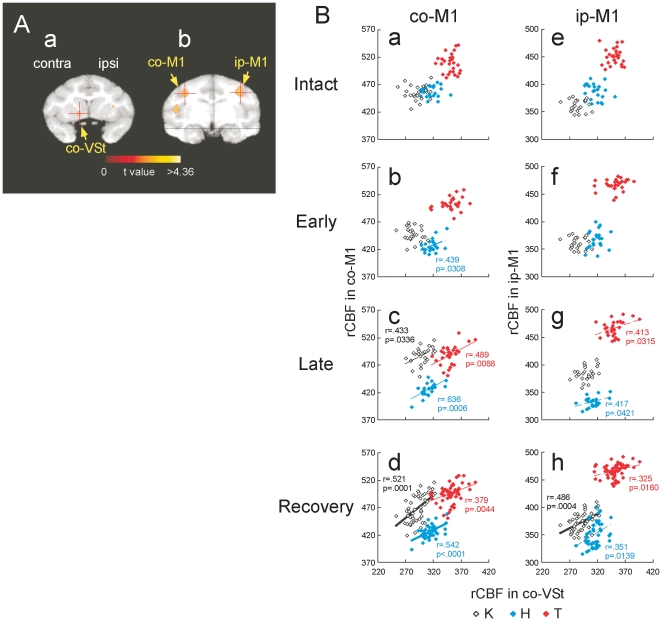
Figure 2. The correlation of rCBF between the ventral striatum (VSt) and the primary motor cortex (M1) before and after spinal-cord injury.
(A) Region of interest (ROI) in the ventral striatum (a, co-VSt), contralesional primary motor cortex (left on b, co-M1) and ipsilesional primary cortex (right on b, ip-M1). Each ROIs were indicated by crossed point of the red lines. (B) The correlation of rCBF between the VSt and the M1 before and after the spinal-cord injury. Scatter plot diagrams show the correlation of rCBF between the VSt and the co-M1, and between the VSt and ip-M1 during intact (a and e), early recovery (1–2 months after lesion, b and f), late recovery (3–4 months after lesion; c and g) and recovery (including the data from both early and late recovery; d and h) stages. Individual data points indicate the data from individual sessions of the PET scan in each monkey that are shown with different symbols. Numerals beside the regression lines indicate Pearson's correlation coefficients (r) (dotted line: P<0.05, thin line: P<0.01, bold line: P<0.001) and P-values (p). The plots without the r and p-value, indicate no significant correlation (All the r- and p-values are shown in Table S1).

