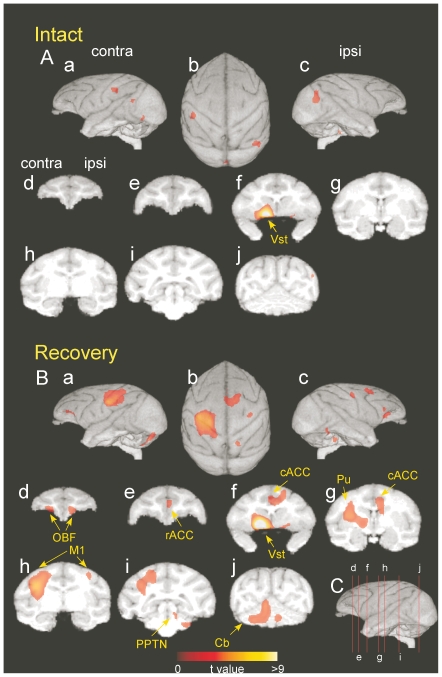
Figure 3. Strength of functional connectivity of individual brain regions with the contralesional ventral striatum before and after spinal-cord injury.
(A) Preoperatively, (B) postoperatively. Average data obtained from the three monkeys. The correlations were calculated between the rCBF value of the ROI in the contralesional ventral striatum (co-VSt, see Fig. 2Aa) and that in other regions during the precision grip task. Brain areas that have significant positive correlation (P<0.01, uncorrected for multiple comparisons) are indicated on a three-dimensional reconstruction of a template brain MRI of macaque monkeys. The significance level is given in terms of t-values represented in a colored scale. (A) and (B) are the results during the intact and recovery stages (including the data from both early and late recovery), respectively. Views are from the contralesional hemisphere (a), top (b), ipsilesional hemisphere (c), and coronal sections (d–j). Lines drawn on the lateral views of the brain in C correspond to the levels of coronal sections of (d–j) in A and B.

