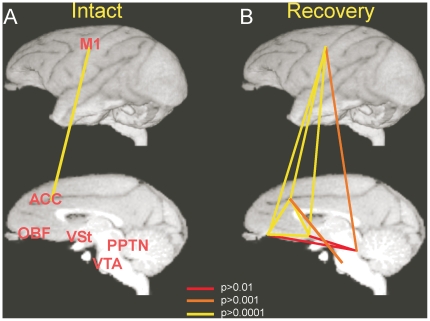
Figure 4. The functional connectivity among individual brain regions during the preoperative and postoperative stages.
Strength of functional connectivity between two regions out of M1, VSt, ACC, OBF, PPTN and VTA are indicated by the color of individual lines connecting the two regions. (A): Intact, (B): Recovery stage. The colors of lines indicate the intensity of the connectivity represented by p-values of correlation.

