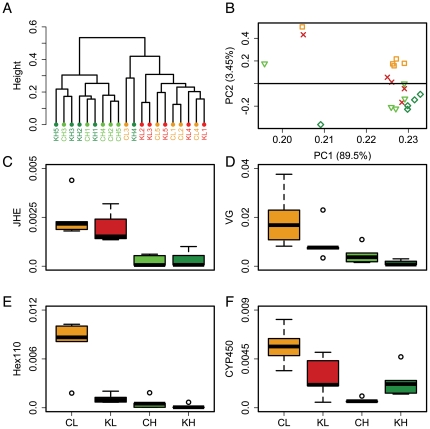
Figure 1. Genotype and manipulation of irs expression influence the proteomic pattern on a global and individual protein level.
Color-coding: Orange: low pollen hoarding genotype control (CL), Red: low pollen hoarding genotype knockdown (KL); Light green: high pollen hoarding genotype control (CH); Dark green: high pollen hoarding genotype knockdown (KH). A: Hierarchical clustering analysis of log2-transformed abundance values of all quantifiable proteins from experiment 1; B: Principal components analysis based on the Pearson correlation matrix of all quantifiable proteins. Squares: low pollen hoarding genotype control, dagger: low pollen hoarding genotype knockdown, triangles: high pollen hoarding genotype control, diamonds: high pollen hoarding genotype knockdown; C, D, E, and F: Boxplots (medians and 25–75 percentiles) of corrected spectral count as a measure of abundance for juvenile hormone esterase (JHE), vitellogenin (VG), hexamerin 110 (Hex110), and cytochrome P450 monooxygenase (CYP450), respectively. Non-parametric Kruskal Wallis and Mann Whitney U tests (p<0.1, bootstrap verified cutoff) showed genotype effects on all four proteins and knockdown effects on VG, hexamerin 110, and cytochrome P450.

