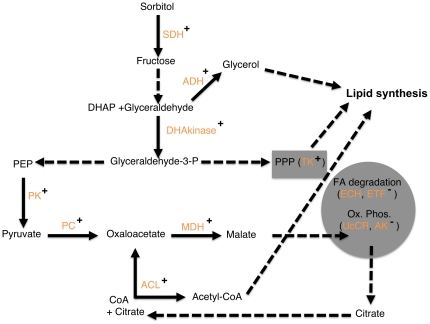
Figure 3. A model for possible metabolic connections in the honeybee abdomen.
The model integrates findings on protein abundance from the low strain control bees and metabolic connections described in the literature (see text for details). Plus sign: higher abundance in 9-day-old vs 11-day-old bees. Minus sign: lower abundance in 9-day-old vs 11-day-old bees. Solid arrows: enzyme (shown in orange) showed age-dependent abundance differences. Dashed arrows: no evidence found in the present data but connections are supported by vertebrate studies. The model proposes a shift from lipogenesis to lipid degradation and higher oxidative phosphorylation with increasing age. SDH: sorbitol dehydrogenase; ADH: alcohol dehydrogenase; DHAkinase: dihydroxyacetone kinase; TK: transketolase; PK: pyruvate kinase; PC: pyruvate carboxylase; MDH: malate dehydrogenase; ACL: ATP-citrate lyase; ECH: enoyl CoA hydratase; ETF: electron trasfer flavoprotein; UcCR: Ubiquinol-cytochrome C reductase; AK: adenylate kinase; PPP: pentose phosphate pathway; FA degradation: fatty acid degradation; Ox. Phos: oxidative phosphorylation; PPP: pentose phosphate cycle; FA: fatty acid; grey circle: mitochondrium.

