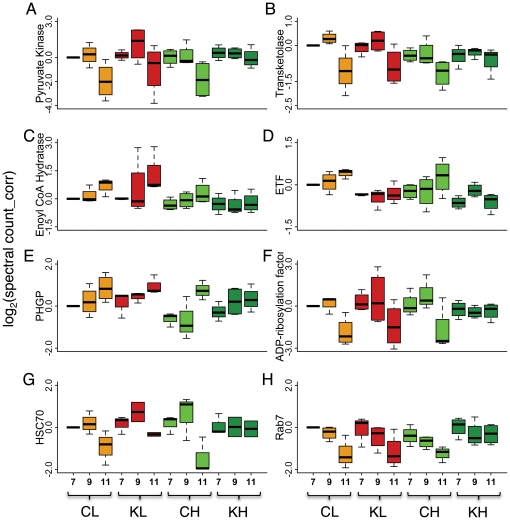
Figure 4. Proteomic indicators of the biosynthetic capacity of the abdomen are affected by treatment, genotype, and age.
Boxplots (medians and 25–75 percentiles) of normalized protein abundance for A: PK (pyruvate kinase), B: TK (transketolase), C: ECH (enoyl CoA hydratase), D: ETF (electron transfer flavoprotein), E: PHGP (phospholipid-hydroperoxide glutathione peroxidase), F: ADP-ribosylation factor, G: HSC70, H: rab7. X-axes: Low pollen hoarding genotype control (CL), low pollen hoarding genotype knockdown (KL), high pollen hoarding genotype control (CH), high pollen hoarding genotype knockdown (KH). Numbers 7–11 refer to the ages (in days) of the bees. Normalized protein abundance: all values are relative to CL7 and log2-transformed. Y-axes: log2(spectral count_corr).

