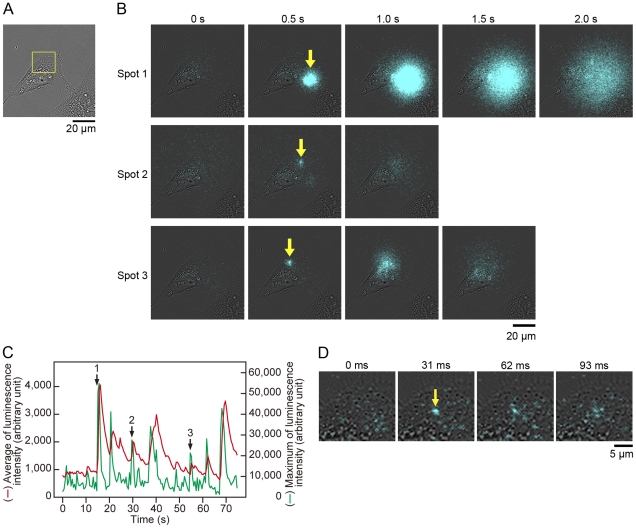
Figure 2. Video-rate bioluminescence imaging of GLase secretion from a single HeLa cell using an EM-CCD camera.
HeLa cells were transfected with pcDNA3-GLuc and cultured for 24 h. (A) Bright-field image of a single cell. Objective lens; 40×. (B) Bioluminescence image of GLase secretion obtained from all area of bright-field image (A). Luminescence signals were recorded with an exposure time of 500 ms per image for 75 s (Video image is in Video S1). Yellow arrows in the images at 0.5 s indicate the luminescence spots in three spots 1–3. (C) Time-dependent changes of the average (red line) and maximum (green line) of luminescence intensities from GLase secretion. The arrows with numbers of 1–3 indicate the luminescence positions, shown as yellow arrows at 0.5 s in (B). (D) Magnified luminescence image of GLase secretion obtained from the area of yellow square in (A). Luminescence signals were acquired with an exposure time of 30.5 ms per image for 4.7 s (Video image is in Video S3).

