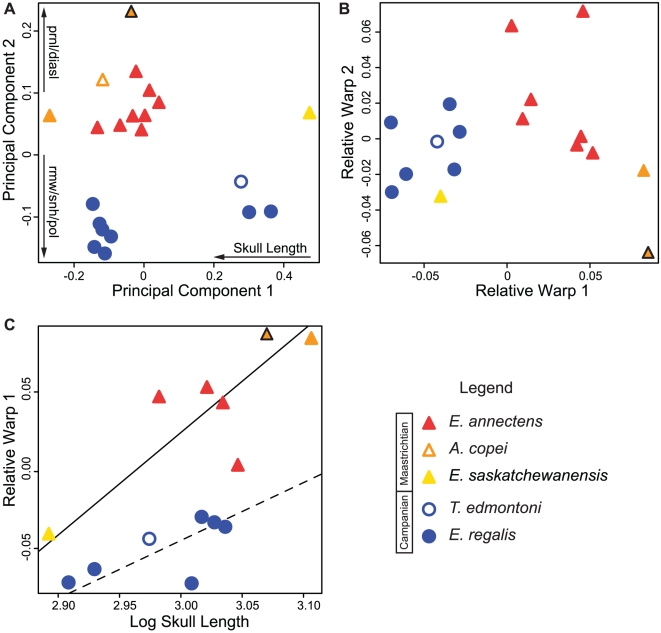
Figure 4. Multivariate and geometric morphometric results.
(A) Plot of the first and second principal component axes (87.3% of the total variation) from the PCA of linear measurements. Arrows show the direction of increase along a PC axis of particular variables. (B) Plot of the first and second relative warps from the geometric morphometric analysis (65% of the total variation). (C) RMA analysis of relative warp 1 (RW1) against skull size. Solid and dashed lines represent the Maastrichtian and Campanian subsamples, respectively (Table 1). The orange triangle with black outline represents the holotype of A. copei (AMNH 5730), and the orange triangle represents the largest skull in the dataset (MOR 003), here assigned to A. copei. Abbreviations: diasl, length of edentulous portion of the dentary; pol, postorbital length; prnl, prenarial length; rmw, width of reflected margin of premaxilla; snh, snout height.

