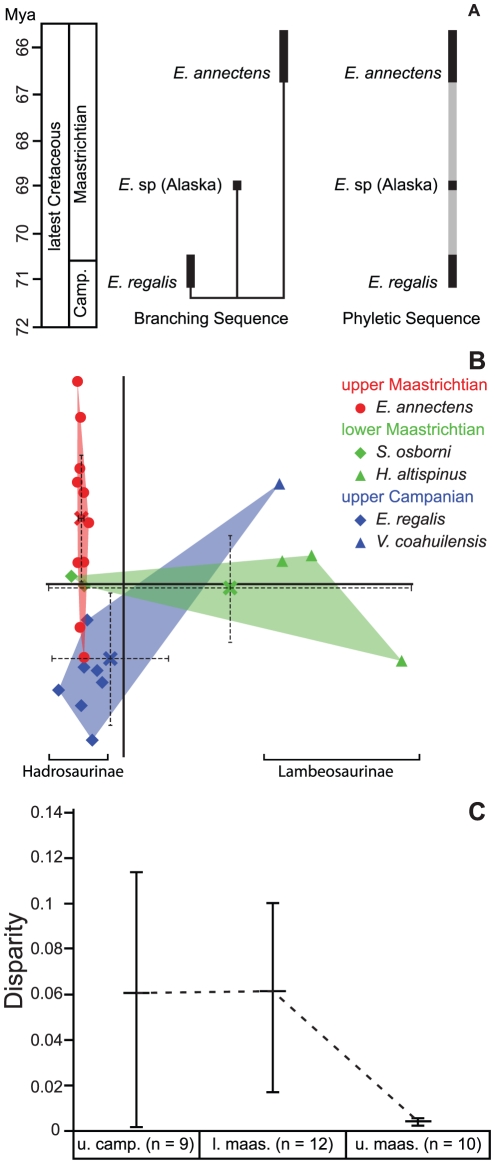
Figure 7. Biostratigraphy and evolution of edmontosaurs and hadrosaurid disparity during latest Cretaceous.
(A) Revised biostratigraphic ranges of edmontosaur species during the latest Cretaceous. Based on our results either a cladogenetic (left) or anagenetic mode (right) of evolution is possible for this genus. (B) Results from the morphometric analysis including virtually all hadrosaurid skulls known from the latest Cretaceous (Figures 2 and S3A). The minimum convex polygons represent specimens known from the three time intervals described in the text. The centroid for each cluster and 95% confidence intervals is marked by an ‘X’ and the dotted lines. (C) Pattern of hadrosaurid morphological disparity, as measured by Foote's Disparity Metric, from 73 to 65 Ma, which shows a significant drop from the early to late Maastrichtian.

