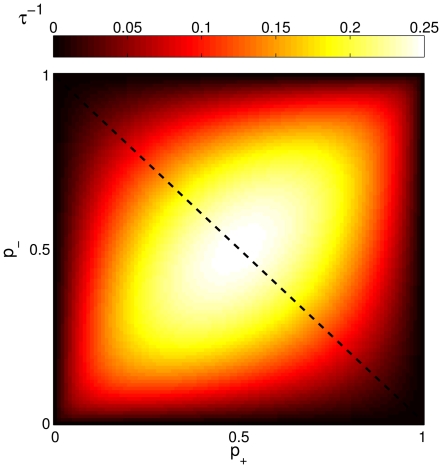
Figure 2. Relaxation timescales.
Inverse time constant for relaxation ( ) as a function of the synaptic parameters
  , obtained in the one-dimensional effective representation (see Eq. 4). The dashed line corresponds to the diagonal
  , along which the range of imposable signals is maximized. The dark regions near the corners correspond to default configurations with long retention times.

