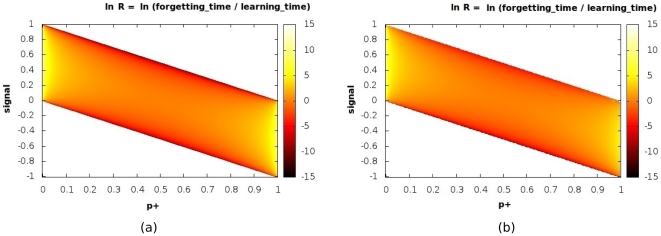
Figure 5. De-adaptation and synaptic parameters.
Variation of the ratio  of the forgetting timescale to the learning timescale for the Signal - No Signal protocol over the two-dimensional
  plane (
 has been chosen here). The values of ln
  are shown color-coded in the panel to the right of each plot. Both the analytical (a) and numerical (b) estimates are shown.

