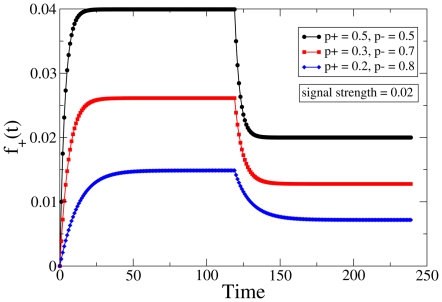
Figure 6. Downscaling protocol.
Time variation of the effective variable  in response to a signal that is reduced by half after a certain period of time (see Fig. 3(b)). The curves for different choices of
  have been translated vertically to meet the baseline for comparative analysis. The black, red and blue curves correspond to
  (0.5, 0.5), (0.3, 0.7) and (0.2, 0.8) respectively, and the (fixed) signal value is
  .
.

