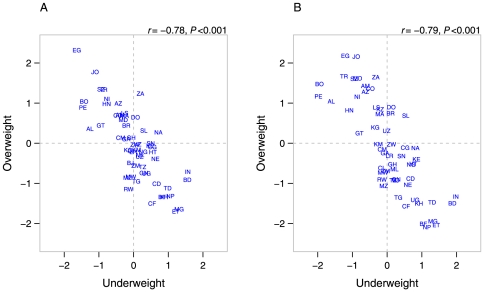
Figure 2. Scatter plots of country-level residuals for underweight and overweight among women aged 20–49 in 57 low- to middle-income countries overall (A), and in low-socioeconomic status groups (B).
Notes: Panel A adjusted for age, education, household wealth, and place of residence, Panel B adjusted for age and urban/rural place of residence. Country abbreviations: AL Albania, AM Armenia, AZ Azerbaijan, BD Bangladesh, BJ Benin, BO Bolivia, BR Brazil, BF Burkina Faso, KH Cambodia, CM Cameroon, CF Central African Republic, TD Chad, CO Colombia, KM Comoros, CD Congo, Dem. Rep., CG Congo, Rep., CI Cote d'Ivoire, DO Dominican Republic, EG Egypt, ET Ethiopia, GA Gabon, GH Ghana, GT Guatemala, GN Guinea, HT Haiti, HN Honduras, IN India, JO Jordan, KZ Kazakhstan, KE Kenya, KG Kyrgyz Republic, LS Lesotho, LR Liberia, MG Madagascar, MW Malawi, ML Mali, MD Moldova, MA Morocco, MZ Mozambique, NA Namibia, NP Nepal, NI Nicaragua, NE Niger, NG Nigeria, PE Peru, RW Rwanda, SN Senegal, SL Sierra Leone, SZ Swaziland, TZ Tanzania, TG Togo, TR Turkey, UG Uganda, UZ Uzbekistan, ZM Zambia, ZW Zimbabwe, ZA South Africa.

