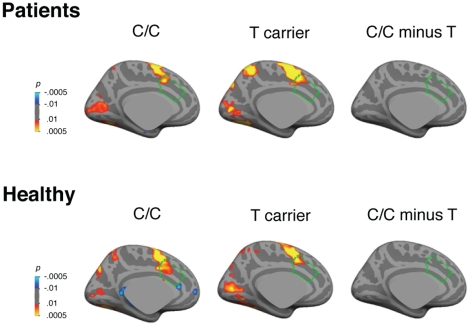
Figure 3. Pseudocolor statistical maps of MTHFR 677C>T genotype effects in the contrast of correct antisaccades versus fixation at 4 s displayed on the left inflated medial cortical surface.
This contrast examines activation related to correctly performing an antisaccade at the time point that shows maximal activation in ocular motor regions in the combined group data. We observed robust activation in the ocular motor network, including in the cingulate eye field (which is within the dACC), that did not differ by genotype group. The dACC is outlined in green.

