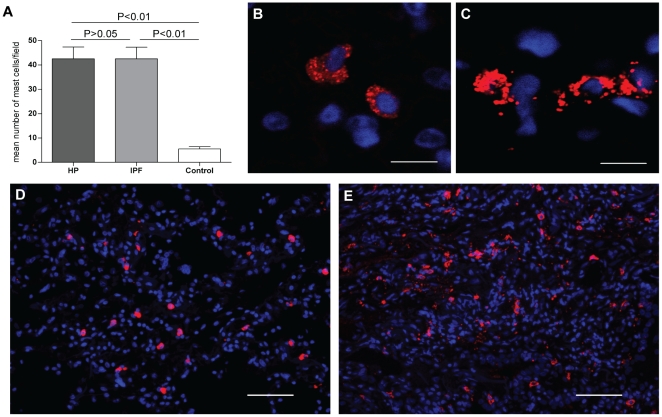
Figure 4. Numerous mast cells are found in the lungs of HP, IPF and control subjects.
The number of mast cells is significantly higher in HP and IPF patients compared to controls (A). Per patient, the mean number of mast cells is calculated by averaging the number of cells counted in seven randomly taken pictures of the tissue. Bars represent the means ± SEM for 5 IPF and 4 HP patients and 3 controls. Representative pictures are shown of tryptase positive mast cells (red) with a non-activated phenotype as mainly found in control tissue (B and D), and tryptase positive mast cells with an activated/degranulated phenotype as mainly found in HP and IPF tissue (C and E). B and C are representative confocal images taken from tissue shown in D and E, respectively. Scale bar B,C: 10 µm; D,E: 50 µm.

