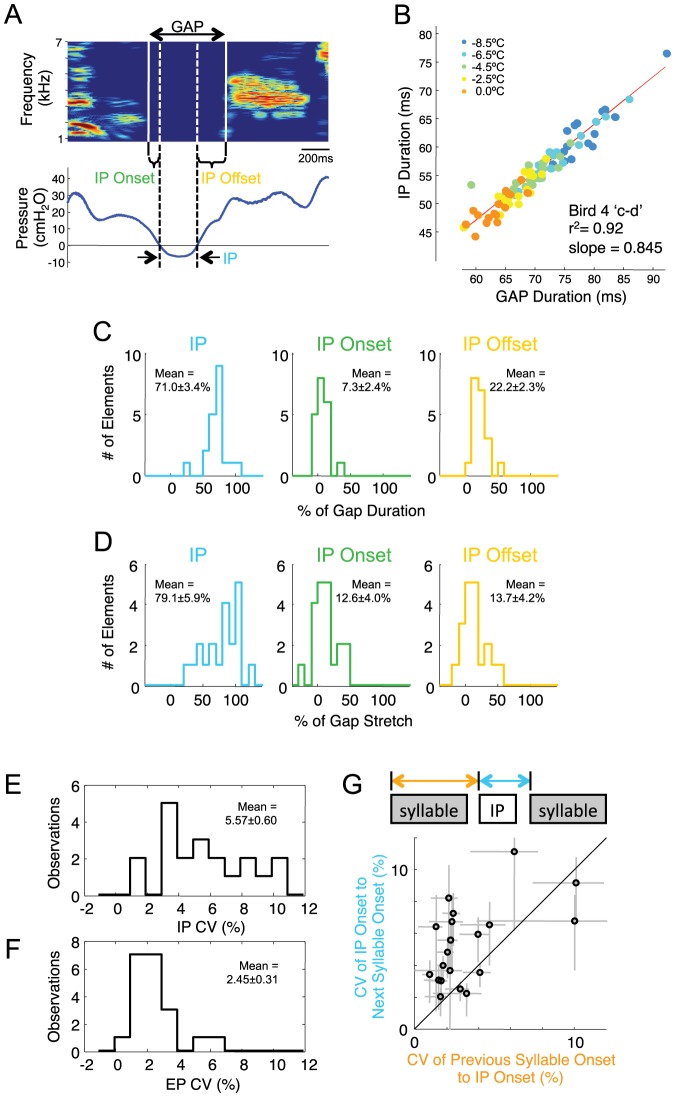
Figure 7. Analysis of respiratory-vocal coordination: HVC cooling and natural variability.
A) Song spectrogram of two syllables showing the silent gap between them, and a simultaneous recording of thoracic air sac pressure. Three distinct components of the gap are identified: the IP onset period (between the end of the syllable and the start of the IP), the IP itself, and the IP offset period (between the offset of the IP and the onset of the syllable). B) Scatter plot of IP duration versus gap duration for 100 renditions of one gap (Bird 4 ‘c–d’) over all temperature conditions (orange, warm; blue, cold). C) Histograms of the fraction of the gap occupied by the three gap components (IP, left; IP onset period, middle; IP offset period, right). Each identified gap (e.g. ‘a–b’, ‘b–c’) is analyzed separately (n = 20 gaps, from directed song only). D) Individual contribution of IP, IP onset period, and IP offset period to the overall temperature-dependent stretch of gaps for all syllable transitions. E) Coefficient of variation (CV) of IP durations (n = 20 identified gaps) and F) CV of EP durations (n = 20 syllables, directed song only). IPs show significantly higher fractional variability than EPs (CV of IPs, 5.57±0.60%; CV of EPs, 2.45±0.31%, p<0.001). G) Scatter plot comparing, for each IP, the CV of the interval from IP onset to both the proceding and the following syllable onset (n = 20 gaps, directed song only).

