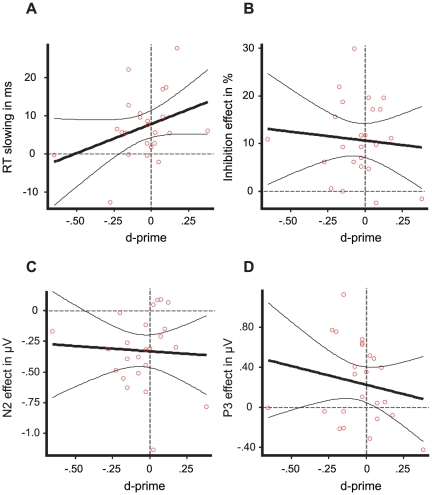
Figure 3. Behavioral and ERP indices of unconsciously triggered inhibition.
Linear regression plots showing extrapolated prime-visibility to the point where the discrimination task showed zero sensitivity (d′ = 0). Regression plots are adjoined by their 95% confidence boundaries. Regression of RT slowing (A) and inhibition rate (B) against d′. Regression of the mean (prime identity related) activity differences of the N2 (C) and the P3 (D) component against d′.

