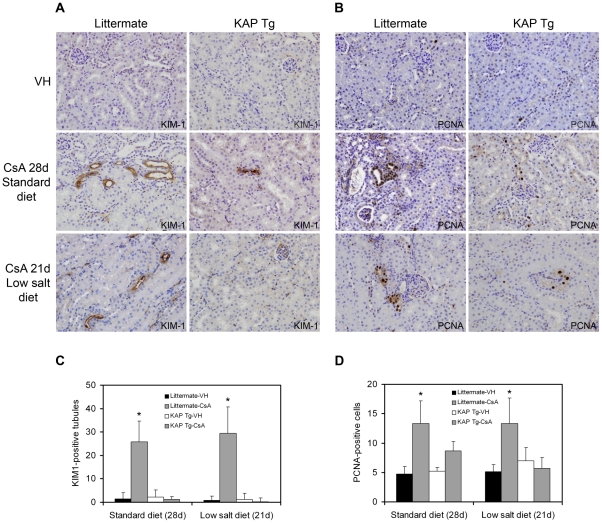
Figure 1. KAP Tg mice are protected from CsA-induced tubular damage.
Expression levels of KIM-1 (A) and PCNA (B) were assessed by immunohistochemical staining in kidney sections of KAP Tg and control littermates treated with CsA, as indicated in Figure 1. Data shown are representative of six animals per group. Magnification: 400x. Quantitative analysis of KIM-1 positive tubules (C) and of PCNA-positive cells (D) of treatment conditions depicted in (A) and (B), respectively, are graphically represented. The number of PCNA-positive cells and KIM-1 positive tubules in each section was determined by counting positively stained cells or tubules in 10 randomly chosen fields (x 200 magnification) per slide. Data represent means ± SD of six animals per group. The littermate-CsA group has more KIM-1 positive tubules, for both standard (p<0.0001) and low-salt (p<0.0001) diets, compared to the littermate-VH, KAP Tg-VH and KAP Tg-CsA groups. Similarly, the littermate-CsA group has more PCNA positive tubules, for both standard (p<0.0001) and low-salt (p<0.0002) diets, compared to the littermate-VH, KAP Tg-VH and KAP Tg-CsA groups (ANOVA, with Tukey post-hoc test). *Significantly higher than KAP Tg-CsA.

