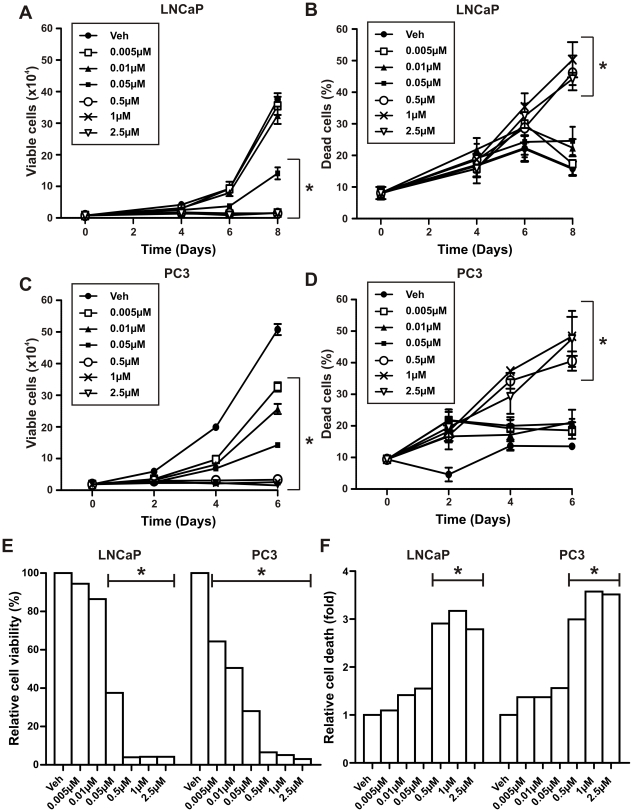
Figure 2. Daily 5-aza-CdR treatment of LNCaP and PC3 prostate cancer cells.
(A–B) LNCaP and (C–D) PC3 prostate cancer cells (1×10⁴ cells per well in 12-well plates) were treated with increasing doses of 5-aza-CdR (0.005–2.5 µM) replenished daily for up to 8 days. (A) and (C) cells were counted at regular intervals using a hemocytometer and the number of viable cells was assessed by Trypan blue dye exclusion. (B) and (D) the number of dead cells is expressed as a percentage of the total number of cells counted. (E) and (F) relative cell viability following 6 or 8 days of treatment with 5-aza-CdR was presented as the percentage of viable cells compared to vehicle control (veh) and relative cell death as the fold of percent of dead cells compared to the veh control. Data at each time-point represents the mean +/− SE of triplicate wells from at least two experiments. *Two-way ANOVA: p<0.05 for (A) (0.01 µM); p<0.001 for (A) (0.05–2.5 µM), (B) and (D) (0.5 µM); p<0.0001 for (C) and (D) (1, 2.5 µM) when compared to vehicle control (veh) on last day of treatment.

