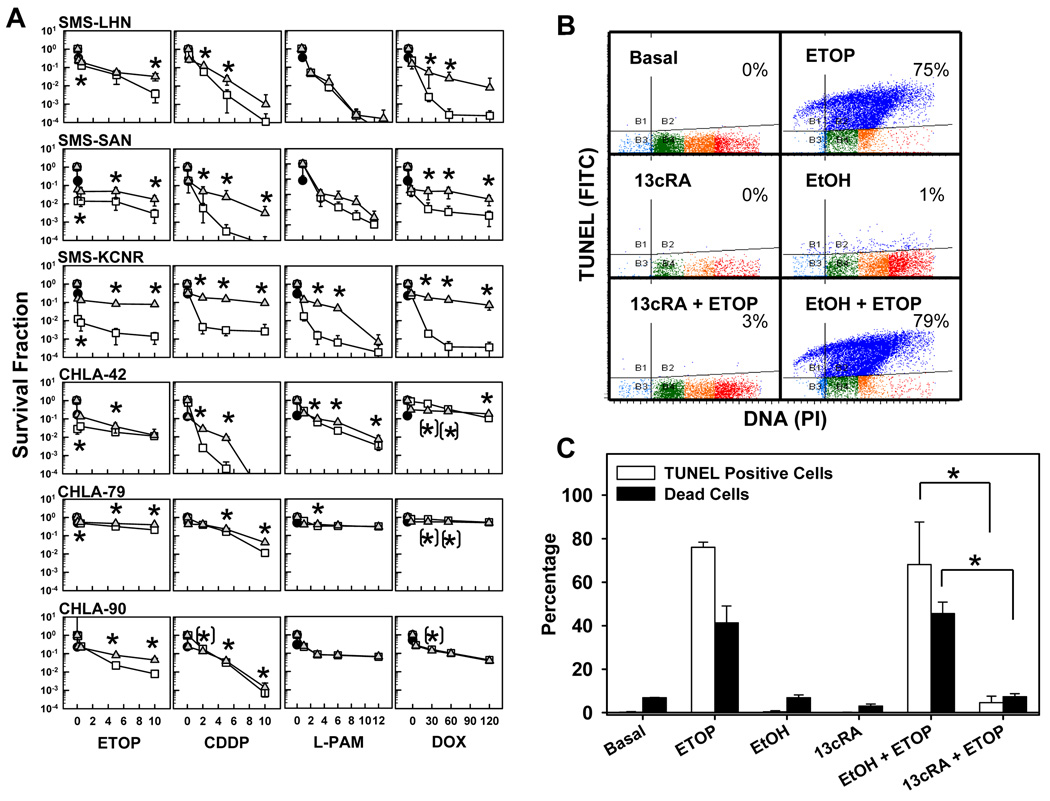
Figure 2. 13-cis-RA pretreatment antagonized the cytotoxicity of etoposide, alkylating agents, or doxorubicin as single agents.
A. Dose-response curves to cytotoxic agents as single agents or in combination with 13-cis-RA. Neuroblastoma cell lines were treated with 13-cis-RA for 48 hours and then exposed to ETOP, CDDP, L-PAM, or DOX for another 7 days. The drug concentrations used were as follows, ETOP (µg/ml) 0.1, 0.5, 5, 10; CDDP (µg/ml) 0.1, 2, 5, 10; L-PAM (µg/ml) 1, 3, 6, 9 and DOX (ng/ml) 5, 30, 60, 120. After a total incubation period of 9 days, cytotoxicity was measured using a DIMSCAN system. Results are expressed as the fractional survival of treated cells compared to control cells after 9 days in 5 µM 13-cis-RA (●), 7 days with the indicated agent ( ), or 2 days in 13-cis-RA followed by 7 days with the indicated agent and 13-cis-RA (
 ). Error bars indicate SD. Significance was defined as (p≤0.05) and significance of the differences between treatments was calculated using two-tailed two-sample t-tests for the three highest drug concentrations. ’*’ indicates statistically significant survival advantage for the combination and ’(*)’ indicates significant advantage for the single agent.
B. Representative dot plots and corresponding percentages, showing cells undergoing DNA fragmentation, staining positively by TUNEL stain. SMS-KCNR cells were treated with 13-cis-RA and ETOP as described and used for TUNEL staining and flow cytometry. The Y-axis indicates TUNEL staining (using a FITC labeled antibody) and corresponds to the amount of DNA fragmentation. The X-axis indicates DNA content by propidium iodide staining. Quadrant markers were drawn in the cytograms to delineate healthy cells in the lower right, and cells with degraded DNA (sub-G1 DNA content) but little or no DNA fragmentation in the lower left. Cells in the upper left have degraded sub-G1 DNA content and fragmented DNA, and the upper right quadrant contains cells with DNA strand breaks, but without DNA loss. Blue indicates cells with DNA strand breaks, cells with sub-G1 DNA content but without DNA breaks are in turquoise, and healthy cells with G1, S and G2/M DNA content are in green, orange and red respectively.
C. Bar graph indicating average values of TUNEL assay results described above and corresponding sample viability. Open bars illustrate the average frequency of cells with fragmented DNA Vs treatment. Black bars indicate sample viability. Assessment of sample viability was determined by the trypan blue exclusion method and a hemocytometer. Triplicate results from vehicle control + ETOP were compared to those from 13-cis-RA + ETOP using two-tailed Student’s T-test. Asterisks indicate significant differences (p≤ 0.05). (13cRA = 13-cis-RA)

