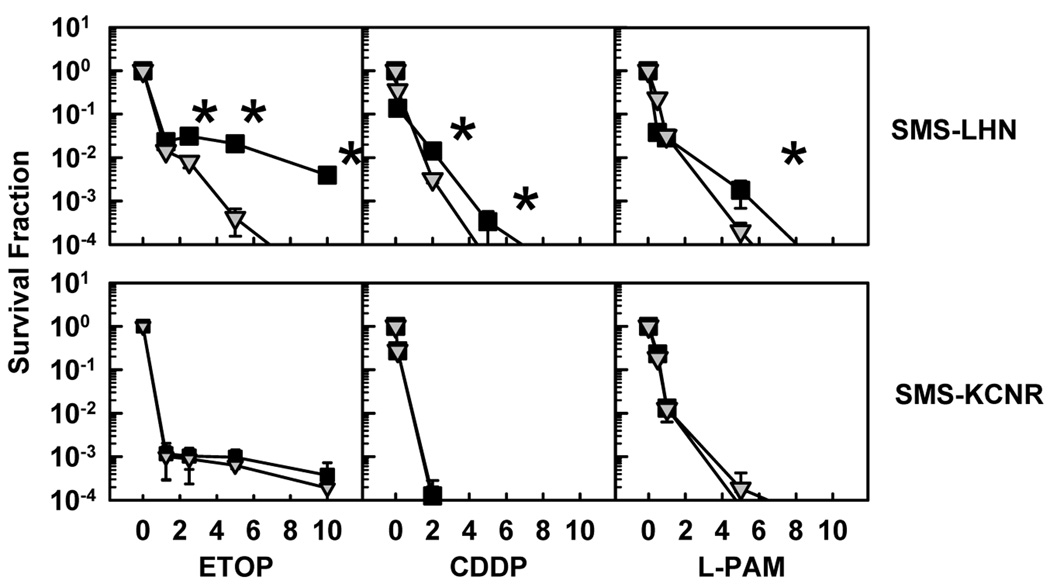
Figure 6. Resistance to RA does not protect against etoposide, cisplatin, or melphalan cytotoxicity.
SMS-LHN and SMS-KCNR cell lines and the corresponding cell lines selected for retinoic acid resistance (SMS-LHN 12xRR, SMS-KCNR 12xRR) were treated with ETOP, CDDP, or L-PAM for 7 days. The drug concentrations used were, ETOP (µg/ml) 1.25, 2.5, 5, 10; CDDP (µg/ml) 0.1, 2, 5, 10 and L-PAM (µg/ml) 1, 3, 6, 9. Cytotoxicity was measured using a DIMSCAN system. Results are expressed as the fractional survival of treated cells compared to control cells. Parental cell lines are indicated by ( ) and RA-resistant cell lines are indicated by (■).Error bars indicate SD. Two-tailed t-tests were used to determine significant (p<0.05) differences between plots for the three highest drug concentrations. Asterisks indicate significant differences between responses.

