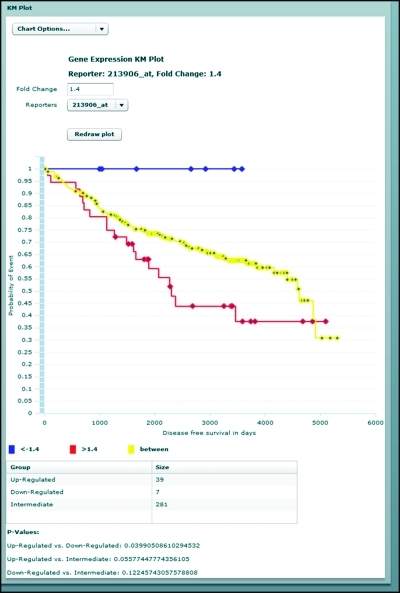
Figure 8.
G-DOC supports the generation of Kaplan-Meier plots to help visualize the effect of gene overexpression on patient survival. Note here that the effect of strong overexpression (red) versus strong underexpression (blue) of MYBL1, as seen in the data set of Loi et al. [29], shows a statistically significant impact on patient survival. Differences in survival between either of these groups and patients with intermediate expression (yellow line) are not statistically significant.

