Figure 8.
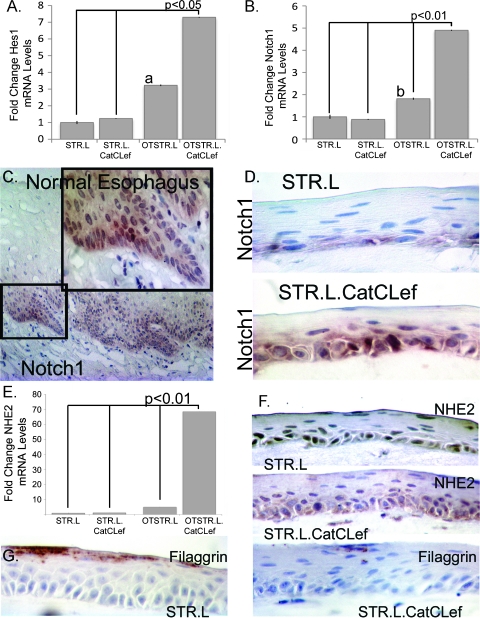
CatCLef expression enhances Notch signaling and alters STR cell differentiation. (A and B) Quantitative SYBR Green RT-PCR analysis of Hes1 (A) and Notch1 (B) mRNA expression in STR.L or STR.L.CatCLef cells cultured under normal two-dimensional conditions or under three-dimensional organotypic conditions (OTSTR.L and OTSTR.L.CatCLef). ΔCt values were calculated after duplicate PCRs for each sample and statistical analysis was performed (analysis of variance and Tukey rank mean). ΔΔCt values were then calculated and used to determine fold change in expression. n = 4. aSignificantly differs from STR.L cells, P < .05. bSignificantly differs from STR.L.CatCLef cells, P < .05. (C) Immunohistochemistry for Notch1 in normal human esophagus. (D) Notch1 immunohistochemistry in organotypic cultures of STR.L and STR.L.CatCLef cells. (E) Quantitative SYBR Green RT-PCR for NHE2 mRNA levels in STR.L or STR.L.CatCLef cells cultured under normal two-dimensional conditions or under three-dimensional organotypic conditions, n = 4. (F) NHE2 immunohistochemistry in organotypic cultures of STR.L and STR.L.CatCLef cells. (G) Filaggrin staining in organotypic cultures of STR.L and STR.L.CatCLef cells.

