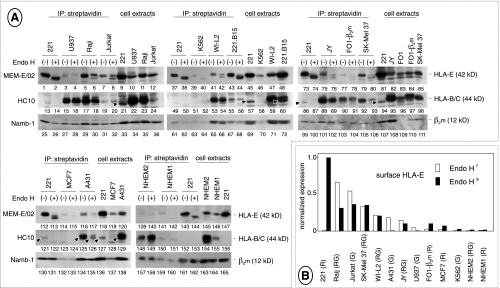
Figure 2.
HLA-E expression on the tumor cell surface. (A) NP40 extracts (1 mg) from biotin-labeled cells were immunoprecipitated by streptavidin-conjugated beads and either digested with Endoglycosidase H [41] or mock-incubated. Surface proteins were resolved by SDS-PAGE, electroblotted, and identified by sequential staining/stripping of the filters with the indicated antibodies. Extracts from biotinlabeled cells (100 µg) were also run side by side. Arrowheads mark residual staining by MEM-E/02 not removed by stripping. Five experiments are shown, each including 221 cells as an internal control. Each cell line was tested at least twice with similar results, except FO-1-β2m cells in which HLA-E expression was slightly underestimated in the experiment shown in the figure, as assessed by two additional experiments. (B) Values of densitometric scans of the Endo H-resistant and Endo H-sensitive HLA-E bands from lanes 2, 4, 6, 8, 40, 42, 76, 78, 80, 115, and 117, sorted by intensity. HLA-E typing, shown in parentheses, was either reported previously [14,15] or assessed by direct DNA sequencing as described [17]. G indicates HLA-E107G; R, HLA-E107R; RG, heterozygous condition.

