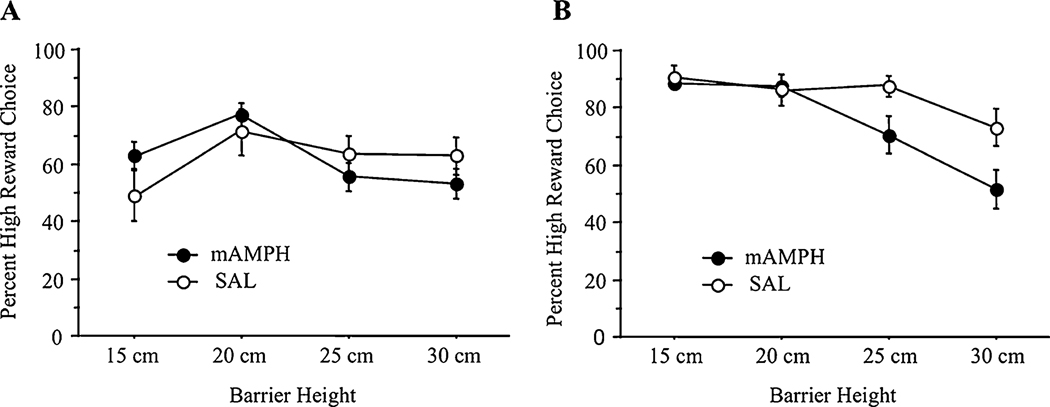
Fig. 2.
Pre- and post-treatment performance over barriers. a Preference scores during pretreatment phase. Mean±SEM percent high reward (HR) choices by prospective treatment group as a function of increasing barrier heights (15, 20, 25, and 30 cm). There were no significant pre-existing group differences on effort (n = 18). b Preference scores during post-treatment phase. Mean±SEM percent high reward (HR) choices by treatment group as a function of increasing barrier heights (15, 20, 25, and 30 cm). Significant treatment group differences emerged only with increasing effort requirement (mAMPH n = 9, SAL n = 6)

