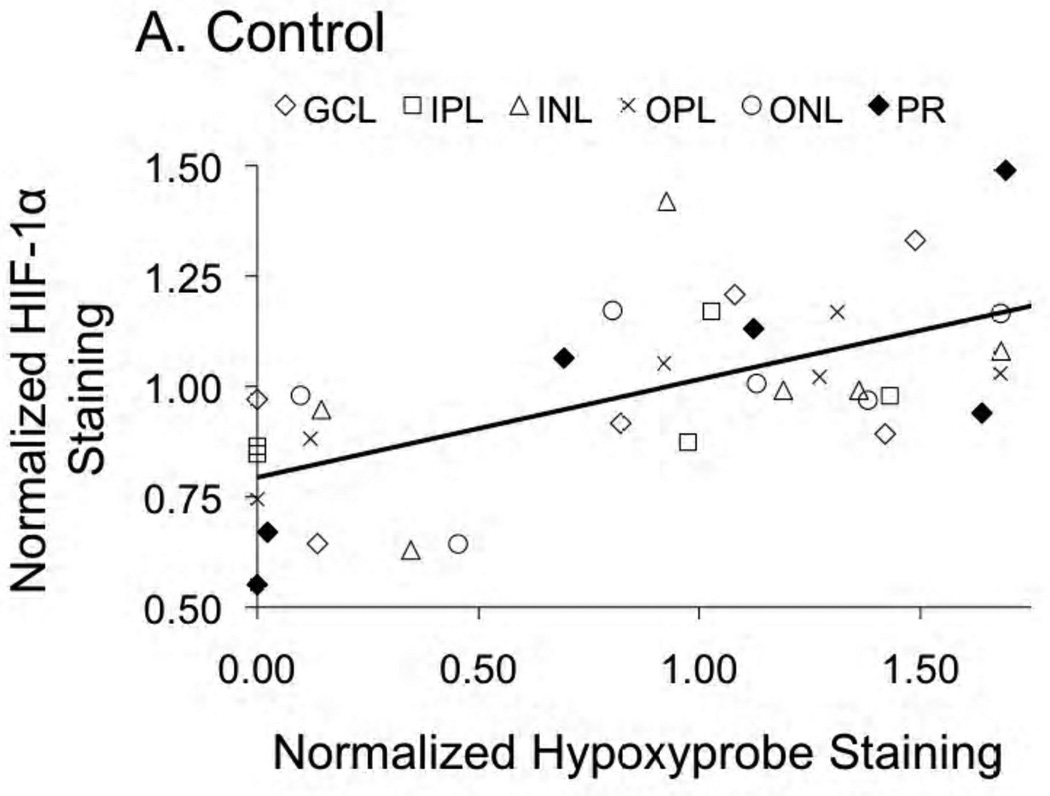
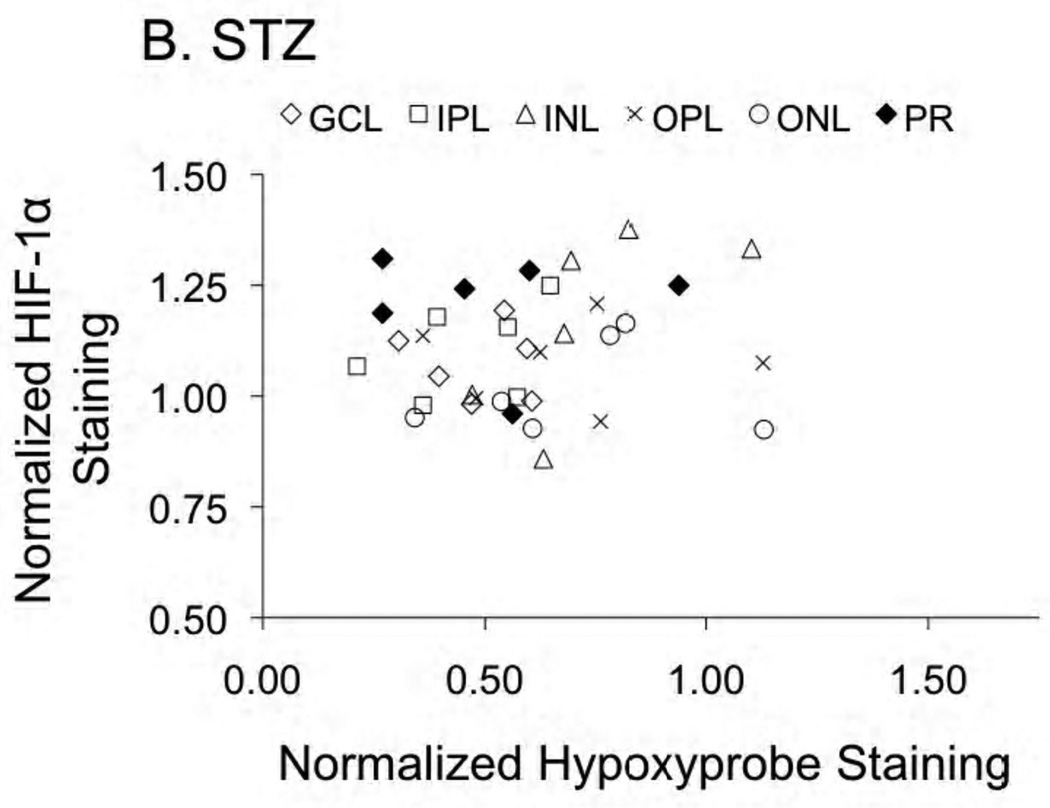
Figure 5.
HIF-1α and Hypoxyprobe staining presented as normalized to the control average. Panel A provides the relationship (r2=0.41; p<0.0001) in control rats; no relationship between the two parameters was found in the STZ rats (panel B). Data are provided for the ganglion cell layer (GCL), inner plexiform layer (IPL), inner nuclear layer (INL), outer plexiform layer (OPL), outer nuclear layer (ONL), and photoreceptor layer (PR).


