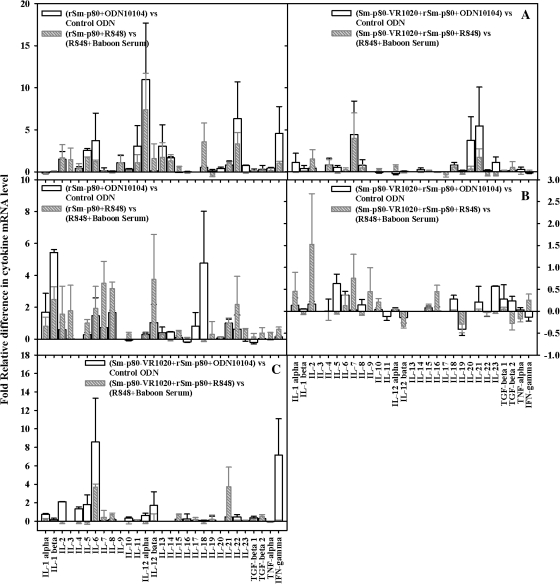
Figure 3.
Relative fold differences in cytokine messenger RNA expression levels by peripheral blood mononuclear cells (A), splenocytes (B), and lymph node cells (C) after 24 hours of stimulation with recombinant Sm-p80 in vitro. The relative cytokine messenger RNA expression level was calculated by comparing the differences in the levels of the control group with those of the respective experimental group after standardization using respective glyceraldehyde 3-phosphate dehydrogenase.

