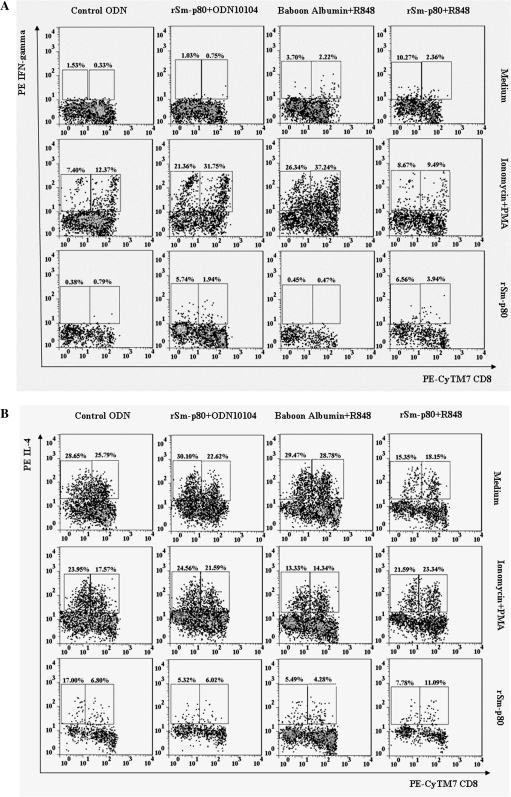
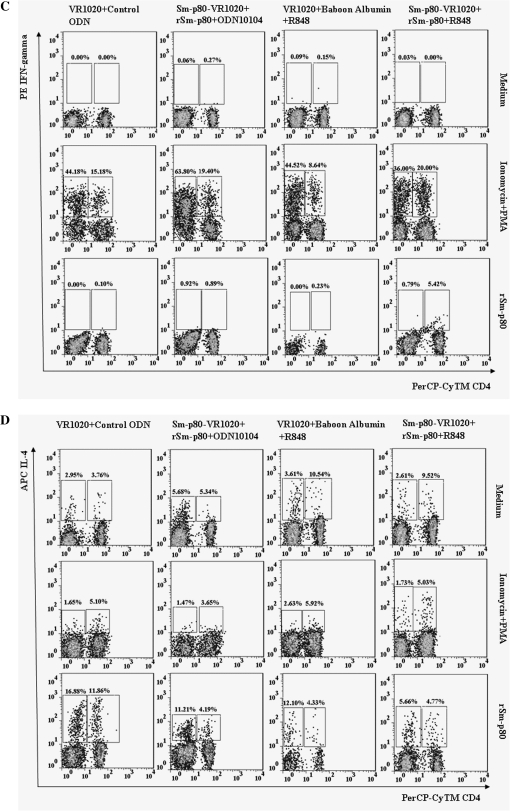
Figure 4.
Quantification of intracellular interferon γ (IFN-γ)– and interlekin 4 (IL-4)–producing CD3+CD4+ and CD3+CD8+ cells from control and vaccinated baboon peripheral blood mononuclear cells. Initial gating was performed using the CD3 marker. A, IFN-γ–producing cells in recombinant Sm-p80 + CpG ODN and Sm-p80 + R848 groups. B, IL-4–producing cells in recombinant Sm-p80 + CpG ODN and Sm-p80 + R848 groups. C, IFN-γ–producing cells in prime-boost groups (Sm-p80− VR-1020 + rSm-p80 + ODN-10104; Sm-p80-VR-1020 + rSm-p80 + R848). D, IL-4–producing cells in prime-boost groups (Sm-p80-VR-1020 + rSm-p80 + ODN-10104; Sm-p80-VR-1020 + rSm-p80 + R848).


