Figure 1.

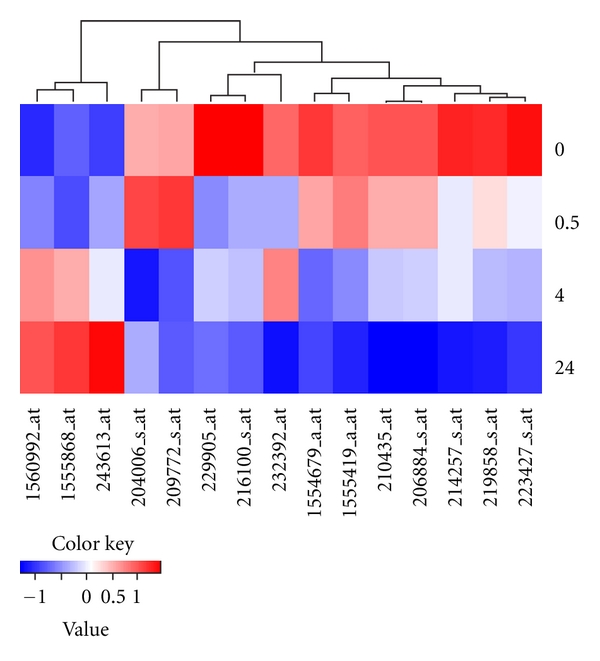
Heatmap showing the mean expression levels for the 15 genes with significant time-course patterns clustered using the hierarchical clustering method and ordered sequentially with time.

Heatmap showing the mean expression levels for the 15 genes with significant time-course patterns clustered using the hierarchical clustering method and ordered sequentially with time.