Figure 4.
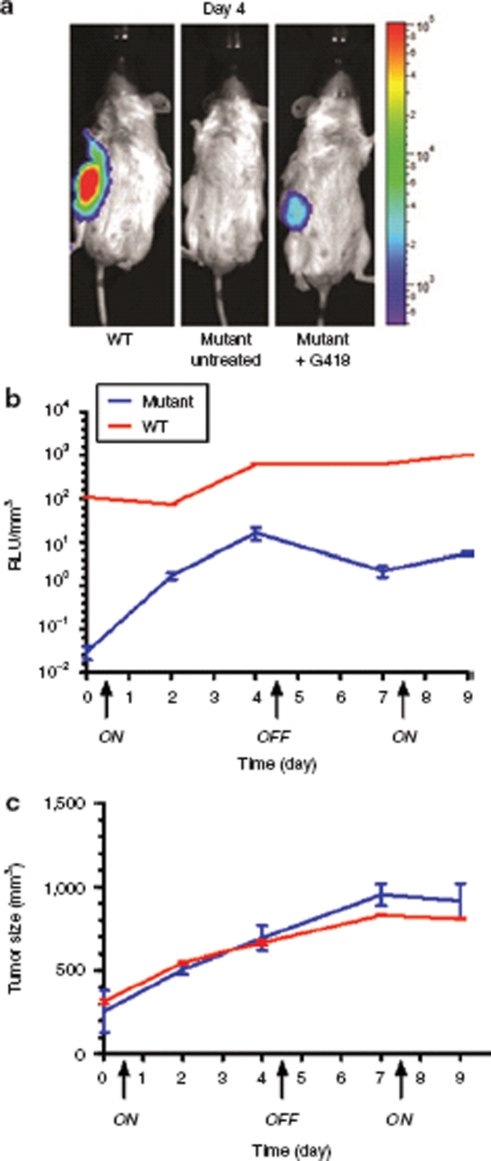
Regulation of hGLuc in U87MG xenograft model. (a) Noninvasive bioluminescence imaging of G418 induced luciferase expression from subcutaneously (s.c.) implanted U87MG xenograft mice on day 4. Control and mutant represent NOD-scid IL2Rgammanull (NSG) mice injected s.c. with transduced U87MG cells harboring the mutant hGLuc construct exposed to phosphate buffered saline and G418, respectively. Wild type (WT) represents NSG mice injected s.c. with transduced U87MG cells harboring the wild-type hGLuc construct exposed to G418. (b,c) The “On” and “Off” regulation of hGLuc expression in a U87MG xenograft model. Luciferase activities were measured in relative light units (RLU) from blood serum. The graph is represented in RLU/mm3 by correlating the luciferase activity to tumor size. The “ON” and “OFF” arrows on the x-axis indicate when the G418 drug was administered and discontinued, respectively. Blood was collected and tumor size was measured, as described in the Material and Method section, prior to every injection of G418. Experiments were repeated twice and each time involved the use of at least three mice per experimental group. All luciferase activity readings from blood serum were done in triplicate.

