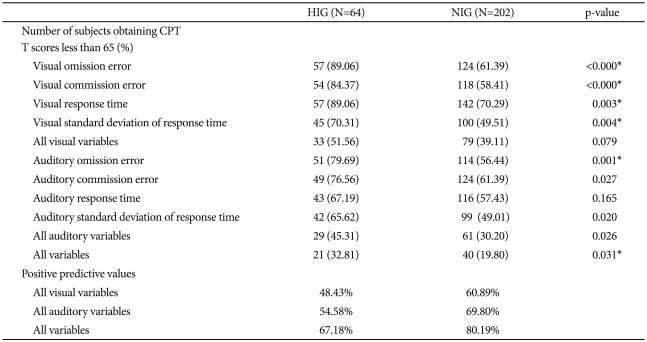
Table 2.
Differences in numbers of subjects obtaining CPT T scores less than 65 and positive predictive values according to IQ group
*these variables were statistically significant, even after applying the Bonferroni correction. CPT: continuous performance test, IQ: intelligence quotient, N: number, HIG: highly intelligent group, NIG: normally intelligent group

