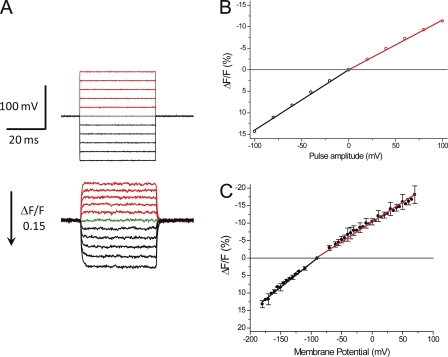
Figure 1.
Calibration of di-8-ANEPPS transients in electrically passive fibers (TEA-Cl + TTX). (A; top) Voltage records, acquired from a fiber clamped at −90 mV, in response to step pulses of amplitudes ranging from −100 to +100 mV in 20-mV increments. Depolarizing and hyperpolarizing pulses are shown in red and black, respectively. The baseline (0 mV) is shown in green. (Bottom) Di-8-ANEPPS transients (single sweeps) acquired in response to the voltage-clamp pulses shown in the top panel. Transients elicited in response to depolarizing pulses are shown in red, and those elicited in response to hyperpolarizing pulses are shown in black. The green trace shows the baseline noise (0-mV pulse). The arrow indicates the magnitude and direction of positive ΔF/F changes. Fiber parameters: radius, 23 µm; length, 490 µm; capacitance, 4.9 µF/cm2. (B) Steady-state amplitude of di-8-ANEPPS transients shown in A plotted as a function of the pulse amplitude. The linear regression fits to the data for hyperpolarizing and depolarizing pulses are shown as solid black and red lines (slopes are 14 and −11 [%/100 mV], respectively). (C). Voltage dependence of the amplitude of di-8-ANEPPS transients recorded from fibers (n = 6) clamped at −90 mV (filled symbols; mean ± SD). The slopes of the linear regressions through the symbols (in [%/100 mV]) are (mean ± SD) 14.3 ± 1.1 (black line) and −11.5 ± 1.2 (red line) for hyperpolarizing and depolarizing pulses, respectively.

